Excel中进行坐标轴添加标题的操作技巧
2017-06-13
相关话题
excel中自动建立的图标是没有坐标轴的标题的,为了让用户看懂图表,我们必须给图表添加坐标轴标题。今天,小编就教大家在Excel中进行坐标轴添加标题的操作技巧。
Excel中进行坐标轴添加标题的操作步骤
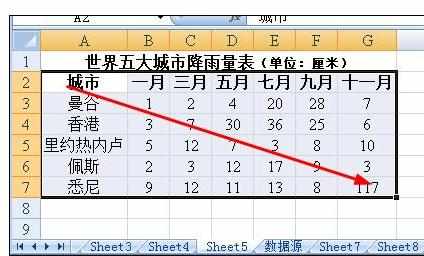
斜着拖动鼠标,选中数据源,据此来建立图表。
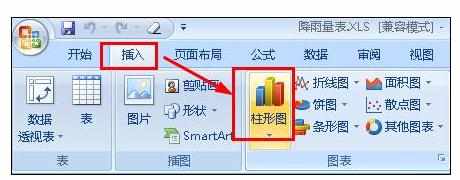
在菜单栏上点击插入--柱形图,选择一种柱形图的样式。
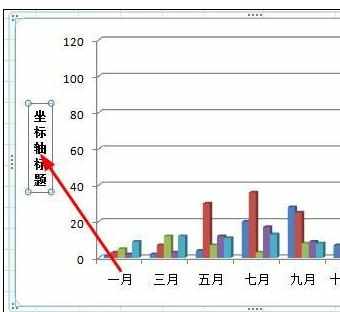
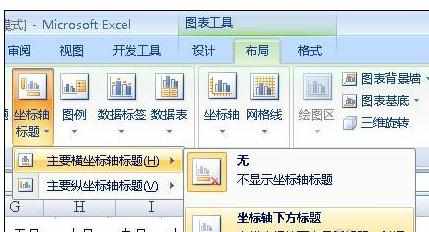
插入了图表以后,我们来给图表添加标题,如图,在菜单栏上执行:坐标轴标题--主要纵坐标标题--竖排标题。
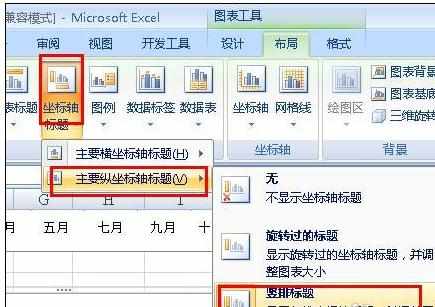
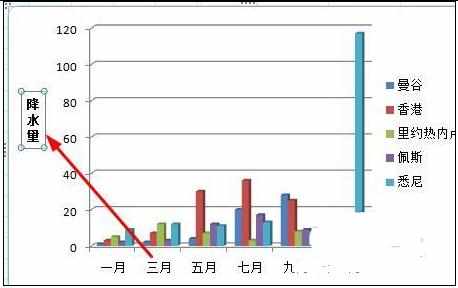
在图表上多了一个文本框,在这个文本框中,将这几个字改为:降水量。
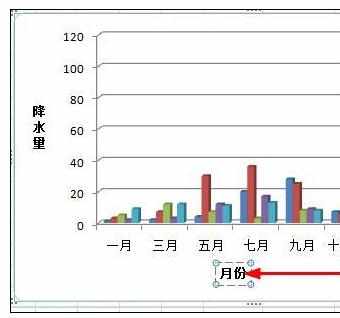
接着再在菜单栏上执行:坐标轴标题--主要横坐标轴标题--坐标轴下方标题。
在添加的文本框中输入:月份,这样给坐标轴添加标题就设置完成了。