ppt2007怎样插入图表制作趋势图
2017-06-13
t2007怎么绘制趋势图?PowerPoint2007中插入图表之后,需要对图表进行分析,做出报告,制成PPT,那么要怎么在ppt2007中制作趋势图呢?下面小编就教你ppt2007绘制趋势图的方法。
ppt2007中制作趋势图的方法
①首先往PPT2007里面插入图表,如有提示出现,那么打开Excel之后再插入就行了。
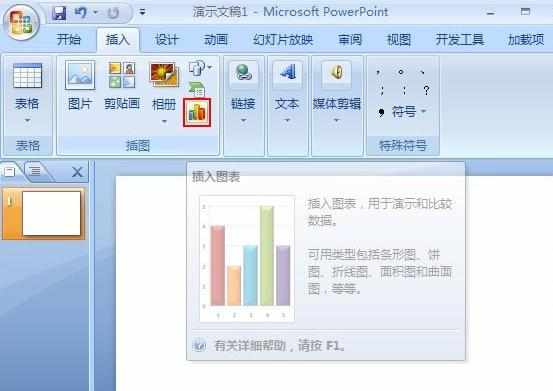
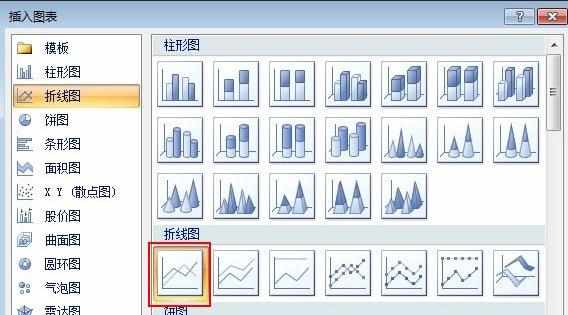
②选择图表样式,可以是线条图也可以是折线图等等。
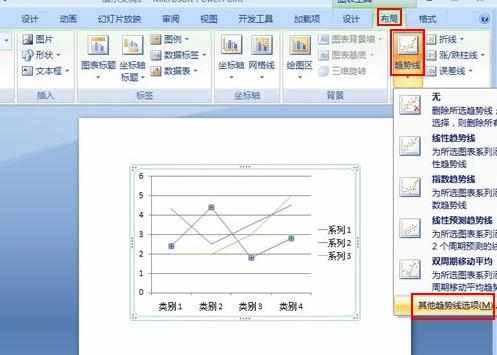
③在图表工具--布局标签里面点击趋势线按钮,然后选择其他趋势线选项。
④勾选多项式,趋势预测可以选为倒推2个周期。
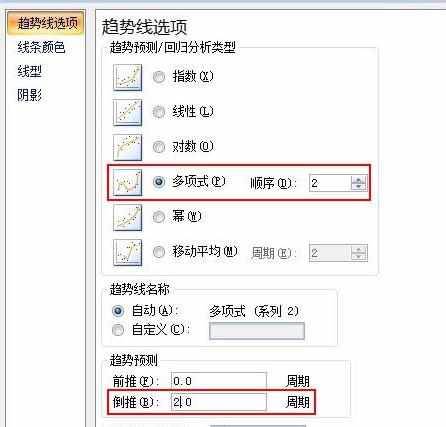
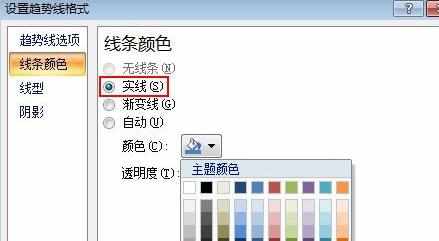
⑤然后设置趋势线的颜色,方便识别。
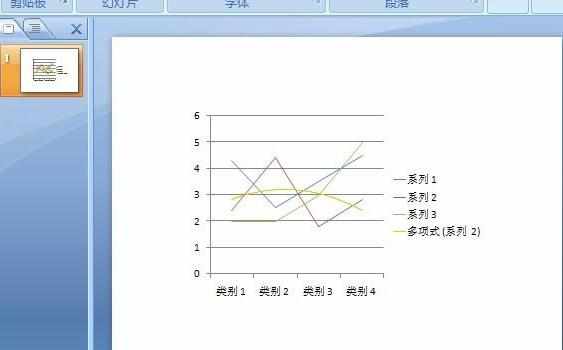
⑥确定之后,图表立即生成趋势线,我们可以通过它来了解图表形势的变化。
猜你感兴趣:
1.怎么在PPT2007幻灯片中插入Excel图表
2.怎么使用ppt2007怎么制作趋势图
3.ppt2007怎么添加图表
4.如何在ppt中插入图表