Excel中2010版进行制作双坐标图表的操作技巧
2017-06-13
相关话题
Excel里面最重要的一项功能就是插入图表,能给整个文件生色不少。现在介绍2010版本如何做双坐标图表。今天,小编就教大家在Excel中2010版进行制作双坐标图表的操作技巧。
Excel中2010版进行制作双坐标图表的操作步骤
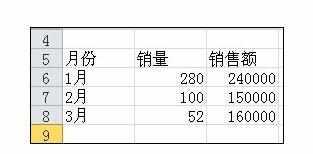
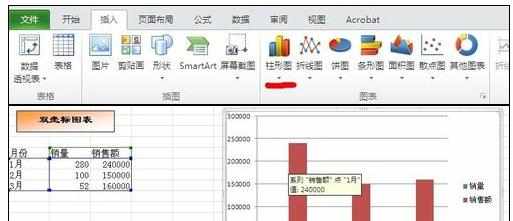
打开Excel文档,例如要分析的数据如图所示。
选择分析的数据,点击插入-柱形图,选择简单的柱形图即可,如图所示。
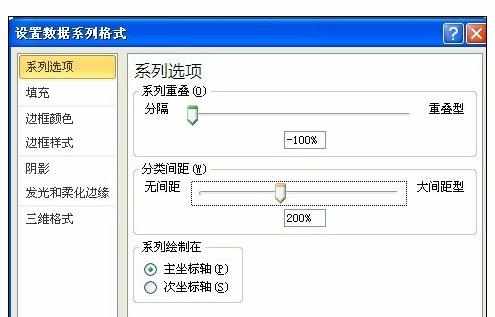
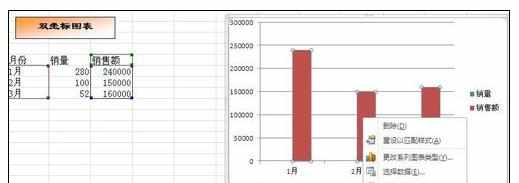
在右键的选项中,选择“设置数据系列格式”。
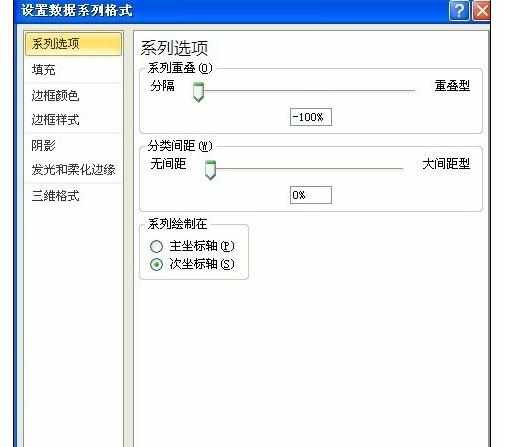
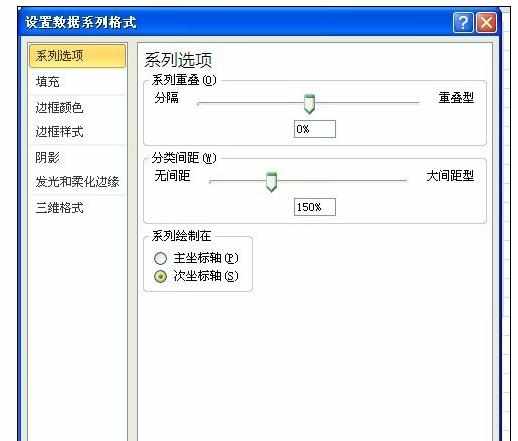
在出现的设置数据系列格式对话框中,选择系列绘制在次坐标轴。
在右键的选项中,选择“选择数据”。
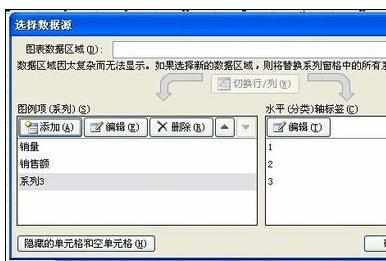
在出现的选择数据源对话框中,单击添加系列,值设为0。
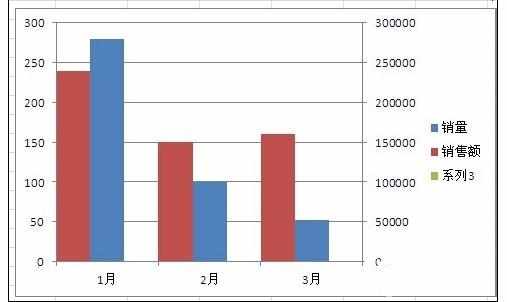
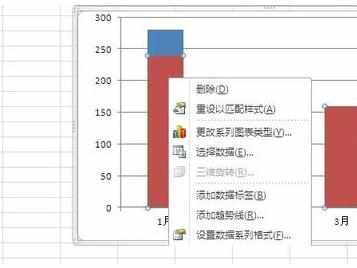
分别双击系列,打开数据系列格式---选项---设置重叠比例和分类间距----直至系列柱形图分开。双坐标图如下图所示。